
We have a guest writer at FYS. When he’s not banging our wives, he’s writing thought provoking articles that you can duke it out to. Jammin and Gentlemen, I give you LoW!
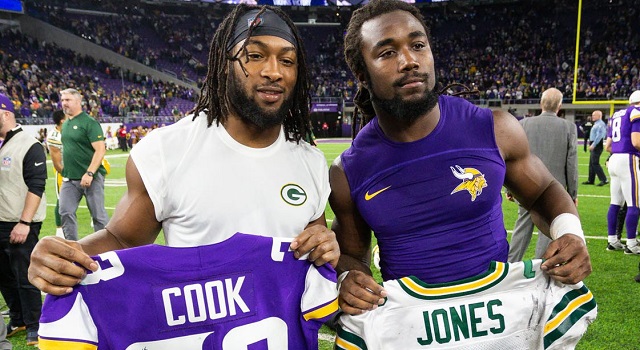
Which RB is most critical? Dalvin Cook v Aaron Jones?
Dalvin Cook holdout, though somewhat amusing to Packers fans right now, it is going to be an issue to both teams. Jones and Cook were drafted on the same year and both contracts come up for renewal at the same time. Right now, Packers management is simply holding out to see the outcome of that contract war.
First, is the fact that so far, comparatively, the Packers have come out ahead in this deal. Dalvin Cook was drafted 2nd round (41st pick) while Packers were fortunate enough to land Jones in 5th round (182nd pick). The fact that Cook comes from a more storied environment and was a regular performer to a national audience along with his first-team all American credentials had a major bearing his draft position. In addition, Cook left as a junior with back to back solid seasons while Jones, who is a year older than Cook in fact missed almost his entire junior season due to an ankle injury. Each set of stats below are listed with Jones above and Cook below.
| Height | School | Age | Weight | Arm length | Hand size | |
| Jones | 5 ft 9 1⁄2 in | UTEP | 23 | 208 lb | 32 1⁄2 in | 9 1⁄2 in |
| Cook | 5 ft 10 3⁄8 in | FSU | 22 | 210 lb | 32 3⁄8 in | 9 1⁄4 in |
Once at the combine, there is nothing major that one could say as to why one looked that much better than the other. Statistically, it seems like Cook was faster on a straight line while Jones was more possibly faster/elusive in a zigzag. It was a tad curious that Jones who is both height and weight wise smaller seemed stronger and could jump higher and longer. Out of respect and civility, we will not mention the fact that Cook is dumber.
| 40-yard dash | 10-yard split | 20-yard split | 20-yard shuttle | Three-cone drill | Vertical Jump | Broad Jump | Bench Press | Wonderlic |
| 4.56 s | 151s | 2.57s | 4.2s | 6.82s | 37 1⁄2 in | 10 ft 7 in | 26 reps | 19 |
| 4.49s | 1.59 s | 2.65 s | 4.53 s | 7.27 s | 30 1⁄2 in | 9 ft 8 in | 22 reps | 11 |
That is all in the past. Once again below, each table presented such as the first one is Jones and then Cook for 2017-2019. It is really hard to pick one distinct better situation. In both cases, both players significantly improved production and the cynic in me will say both sensed 2020 is a contract year and really picked up their performance. But, when it comes to the TD performance, it is impossible to deny the Packers significantly needed Jones compared to the Vikings in need of Cook.
| G | GS | Touch | Y/Touch | YScm | TD | Fmb |
| 12 | 4 | 90 | 5.2 | 470 | 4 | 0 |
| 12 | 8 | 159 | 5.9 | 934 | 9 | 1 |
| 16 | 16 | 285 | 5.5 | 1558 | 19 | 3 |
| 40 | 28 | 534 | 5.5 | 2962 | 32 | 4 |
| G | GS | Touch | Y/Touch | YScm | TD | Fmb |
| 4 | 4 | 85 | 5.2 | 444 | 2 | 1 |
| 11 | 10 | 173 | 5.3 | 920 | 4 | 2 |
| 14 | 14 | 303 | 5.5 | 1654 | 13 | 4 |
| 29 | 28 | 561 | 5.4 | 3018 | 19 | 7 |
Both players were a great outlet for the respective QBs where in the passing game, they were a noteworthy contributor. Once again, it is quite hard to say one player was significantly better than the other but comparatively it does look like Cook seems statistically the more polished receiver at least when it comes to his consistent catch percentage.
| Tgt | Rec | Yds | Y/R | TD | 1D | Lng | R/G | Y/G | Ctch% | Y/Tgt |
| 18 | 9 | 22 | 2.4 | 0 | 2 | 9 | 0.8 | 1.8 | 50.00% | 1.2 |
| 35 | 26 | 206 | 7.9 | 1 | 12 | 24 | 2.2 | 17.2 | 74.30% | 5.9 |
| 68 | 49 | 474 | 9.7 | 3 | 18 | 67 | 3.1 | 29.6 | 72.10% | 7 |
| 121 | 84 | 702 | 8.4 | 4 | 32 | 67 | 2.1 | 17.6 | 69.40% |
| Tgt | Rec | Yds | Y/R | TD | 1D | Lng | R/G | Y/G | Ctch% | Y/Tgt |
| 16 | 11 | 90 | 8.2 | 0 | 3 | 36 | 2.8 | 22.5 | 68.80% | 5.6 |
| 49 | 40 | 305 | 7.6 | 2 | 15 | 27 | 3.6 | 27.7 | 81.60% | 6.2 |
| 63 | 53 | 519 | 9.8 | 0 | 26 | 31 | 3.8 | 37.1 | 84.10% | 8.2 |
| 128 | 104 | 914 | 8.8 | 2 | 44 | 36 | 3.6 | 31.5 | 81.30% |
When it comes to rushing, statistically, Jones had a “contract year” level of performance. What is though undeniable is the both players have shown significant performance improvement with each passing year where it will be relatively hard to deny them their due.
| Rush | Yds | TD | 1D | Lng | Y/A | Y/G | A/G |
| 81 | 448 | 4 | 23 | 46 | 5.5 | 37.3 | 6.8 |
| 133 | 728 | 8 | 41 | 67 | 5.5 | 60.7 | 11.1 |
| 236 | 1084 | 16 | 55 | 56 | 4.6 | 67.8 | 14.8 |
| 450 | 2260 | 28 | 119 | 67 | 5 | 56.5 | 11.3 |
| Rush | Yds | TD | 1D | Lng | Y/A | Y/G | A/G |
| 74 | 354 | 2 | 16 | 33 | 4.8 | 88.5 | 18.5 |
| 133 | 615 | 2 | 22 | 70 | 4.6 | 55.9 | 12.1 |
| 250 | 1135 | 13 | 60 | 75 | 4.5 | 81.1 | 17.9 |
| 457 | 2104 | 17 | 98 | 75 | 4.6 | 72.6 | 15.8 |
Hence the stats really say something that is quite comparable in terms of performance. Anyone would be hard pressed to say one player is noteworthy better than the other one.
But where things now vary is that the Vikings draft was heavily towards defense possibly motivated by key offseason losses while Packers bought a very important insurance policy in the form of A J Dillon. This move I suspect is motivated by the ugly fact that if you stopped comparing them side by side but instead evaluated their importance to their respective teams, Jones is more valuable to the Packers as it stands right now than Cook is to the Vikings.
On the Packers the next 2 top rushers are Williams and Rodgers who barely are half the yards total of Jones. The next top rusher was Allen Lazard. When it comes to scoring, Williams had one rushing TD for all of 2019.
The Vikings are not really significantly better position with the next 2 top rushers accounting for similarly to about half of Cook’s yards but at least those 2 might be comparatively serviceable RBs.
| Pack R-Yds | Jones % | Pack R-TDs | Jones % | Vike R-Yds | Cook % | Vikes R-TDs | Cook % | |
| 2017 | 1,724 | 26% | 13 | 31% | 1,957 | 18% | 15 | 13% |
| 2018 | 1,667 | 44% | 14 | 57% | 1,493 | 41% | 9 | 22% |
| 2019 | 1,795 | 60% | 18 | 89% | 2,133 | 53% | 19 | 68% |
In the passing game, Cook is the 2nd top receiver (ahead of Thielen who was out due to injury) in the Vikings offense. In fact, Cook had more receiving yards than Kyle Rudolph. Jones is not too far lower as the 3rd top receiver ahead of MVS in both receiving yards and scoring. But, it is apparent that Jones is just about as important as Cook in the passing game especially due to his scoring performance.
| Pack P-Yds | Jones % | Pack P-TDs | Jones % | Vike P-Yds | Cook % | Vikes P-TDs | Cook % | |
| 2017 | 3,167 | 1% | 25 | 0% | 3,753 | 2% | 25 | 0% |
| 2018 | 4,238 | 5% | 25 | 4% | 4,036 | 8% | 30 | 7% |
| 2019 | 3,733 | 13% | 26 | 12% | 3,523 | 15% | 26 | 0% |
Though it is a joyous moment watching the Vikings suffer, I can’t help it but worry a bit unless Packers management finds a way to keep Dillon and Jones (good bye Williams) to create a formidable 1-2 punch. It is pretty obvious that in the coming years, the Packers intend to be a more noteworthy rushing team and for that to happen I seriously can’t see this minus Jones.
Packers are currently in a slightly better salary cap situation versus the Vikings but they are truly not that far apart. With the return of a healthy Thielen, the Vikings have the opportunity to go back to their 2018 passing performance where they are not as heavily dependent on Cook. I seriously doubt the Packers are in a comparable position where they can be more reliant on the pass heavy offense.